Skip to content

00 / Case study / TAIS / General Dynamics for U.S. Army

Redesigning the Army’s airspace management system.

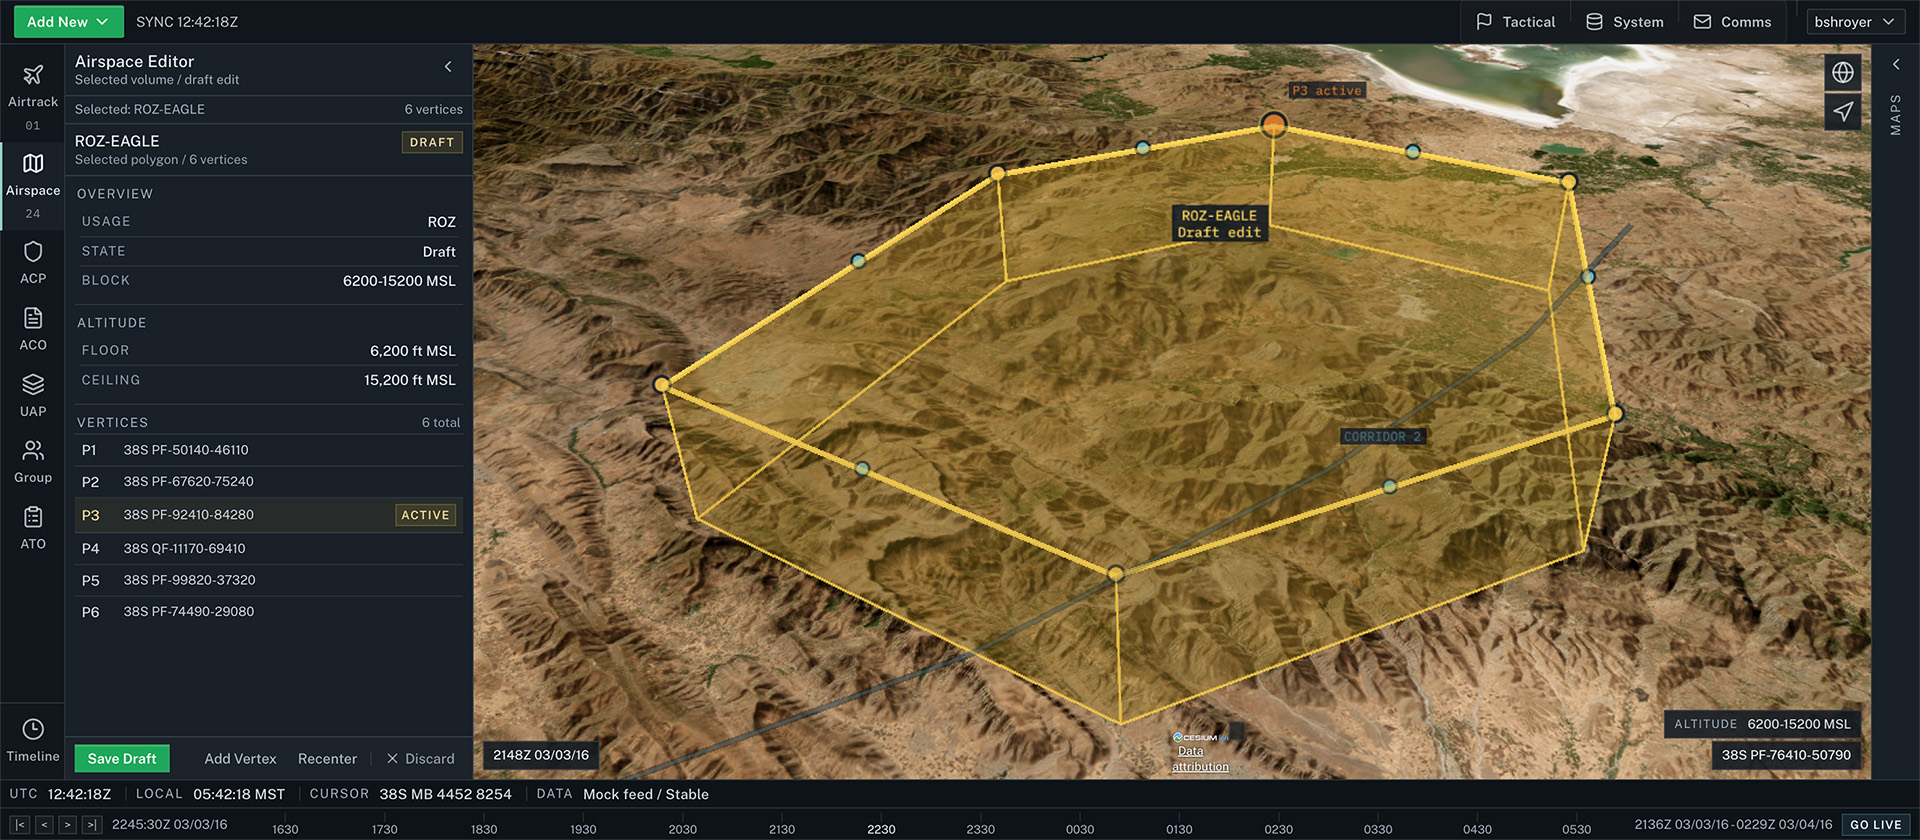
The redesigned airspace editor. The map stays visible while a docked panel carries the detail. Not the fielded interface. Shown with mock data.

The Tactical Airspace Integration System (TAIS) is used by hundreds of soldiers in active theater. I was the sole UX designer on its 2-year modernization. Across 5 rounds of field testing with active-duty soldiers, its usability score rose from 68 to 83.

System Usability Scale score, across 5 rounds of field testing
68 to 83
Delivered for
General Dynamics, for the U.S. Army
Role
Senior UX Designer, sole designer
Team
Product manager, engineering lead, 7 engineers, 2 QA engineers
Duration
2-year modernization
Methods
Field usability testing, System Usability Scale, NASA-TLX
Status
Shipped. In active theater deployment more than a decade later

Delivered by Brad Shroyer as a General Dynamics employee. Shown as principal experience, not as a Veteran Design contract.

01 / Problem

A decade of added features, and the experts were rotating out.

The legacy system had a decade of features added without a view of the whole experience. Windows covered the map, controls sat in nested menus, and every notification looked the same.

The senior operators who could work around it were rotating out. The soldiers replacing them could not complete basic tasks.

02 / Research

Test on base, with the people who use it.

I ran 5 field sessions at an Army base with active-duty soldiers. Each session used a 96-step task script, scored with the System Usability Scale (SUS) and NASA-TLX workload ratings.

The baseline SUS score was 68. Route creation, the most common task, drew a frustration rating of 7.75 on the 21-point NASA-TLX scale. The soldiers understood the concepts. They were fighting the interface.

03 / Design decisions

2 decisions the testing settled.

001 / Docked panels that tear off

I tested 2 interaction models side by side: floating windows and docked panels. Workload scores were nearly identical, but the comments split cleanly.

“If I could tear off windows from B and move them around like A, I would go with B.”

Soldier, field test participant

The shipped design docks panels by default and lets operators tear them off and reposition them.
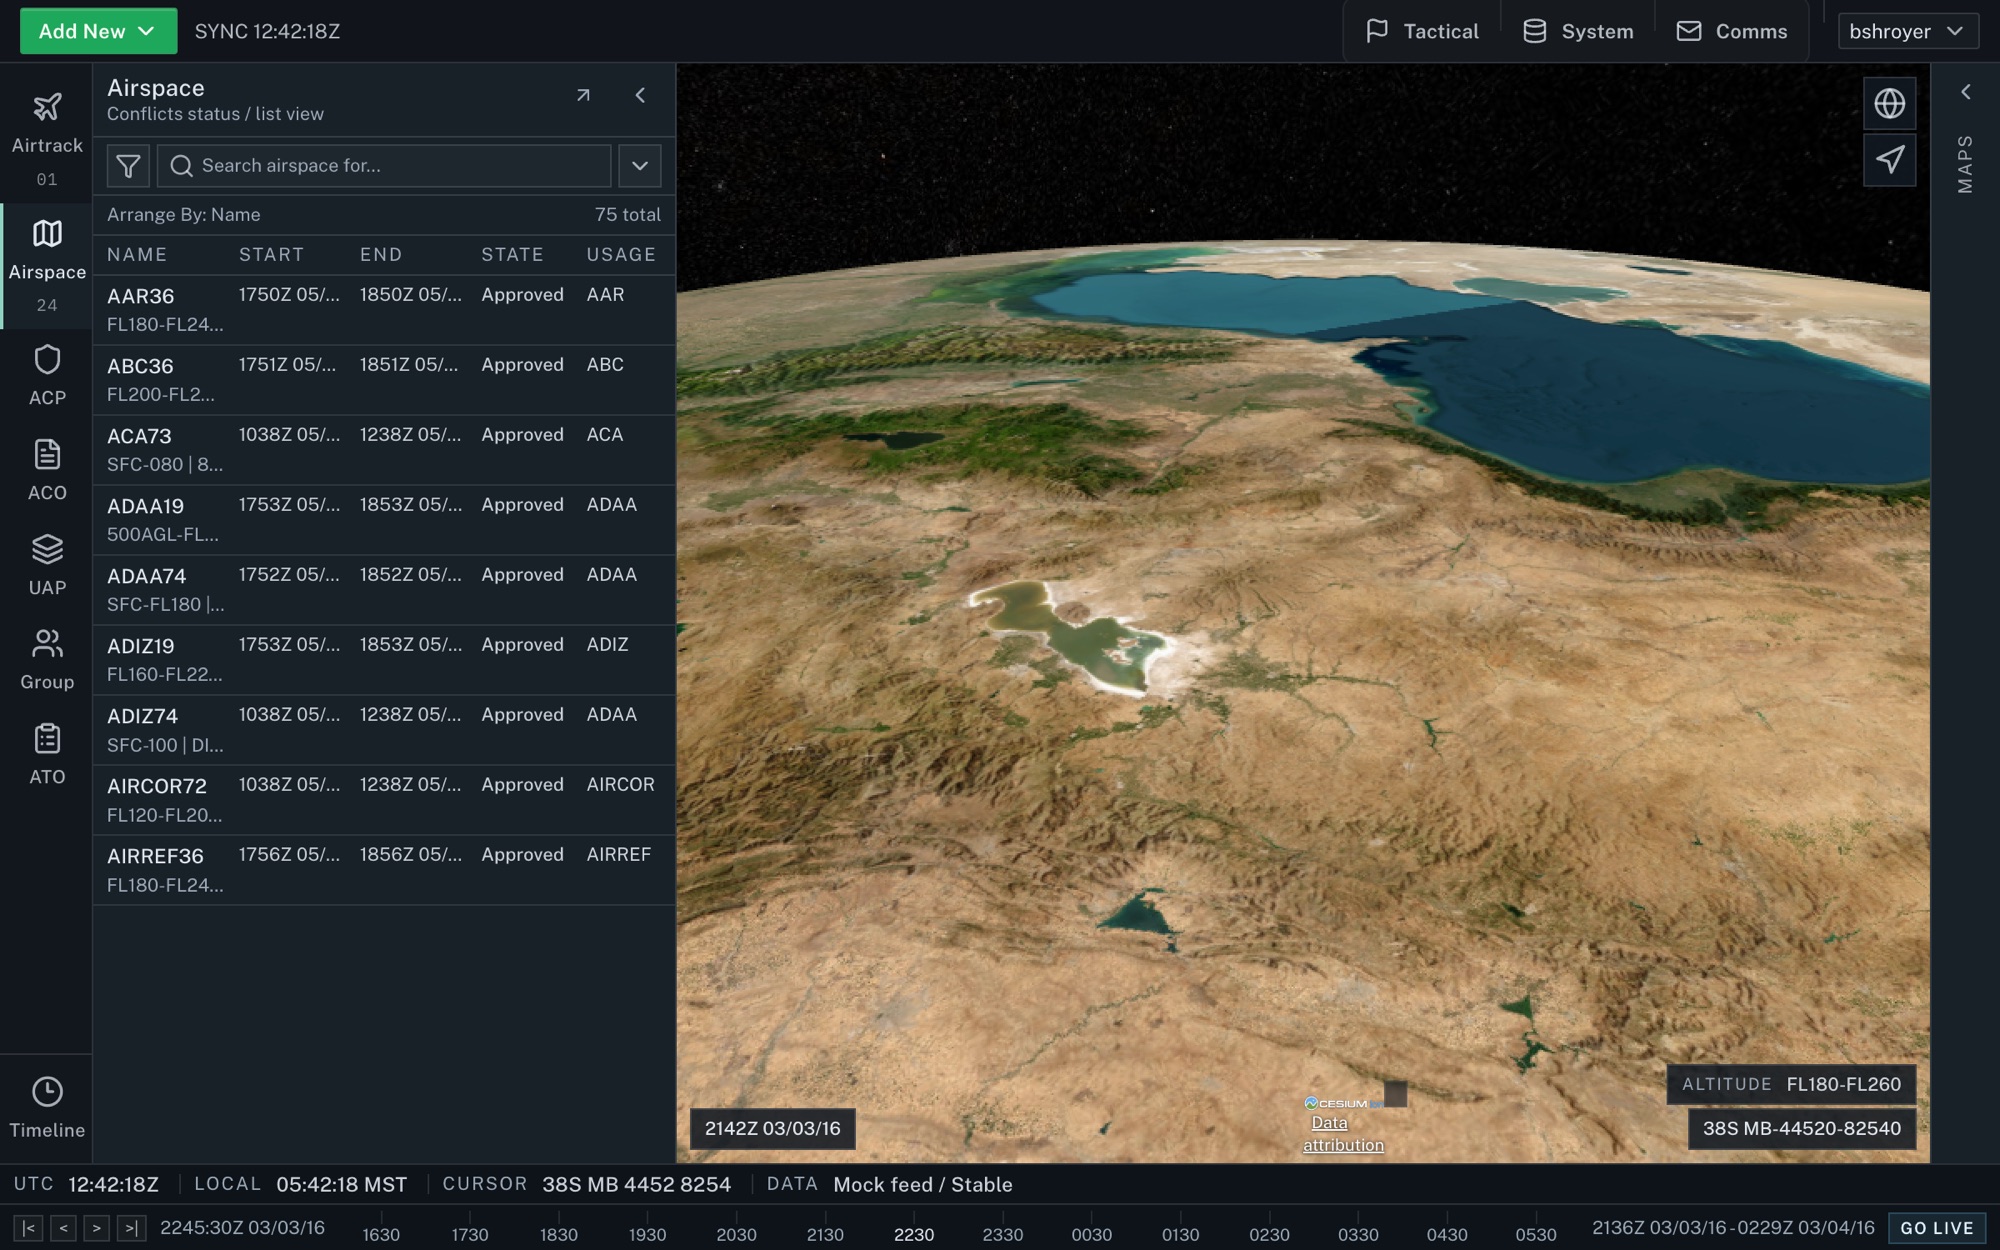
Airspace list docked beside the map. Not the fielded interface. Shown with mock data.

002 / Alerts sorted by meaning

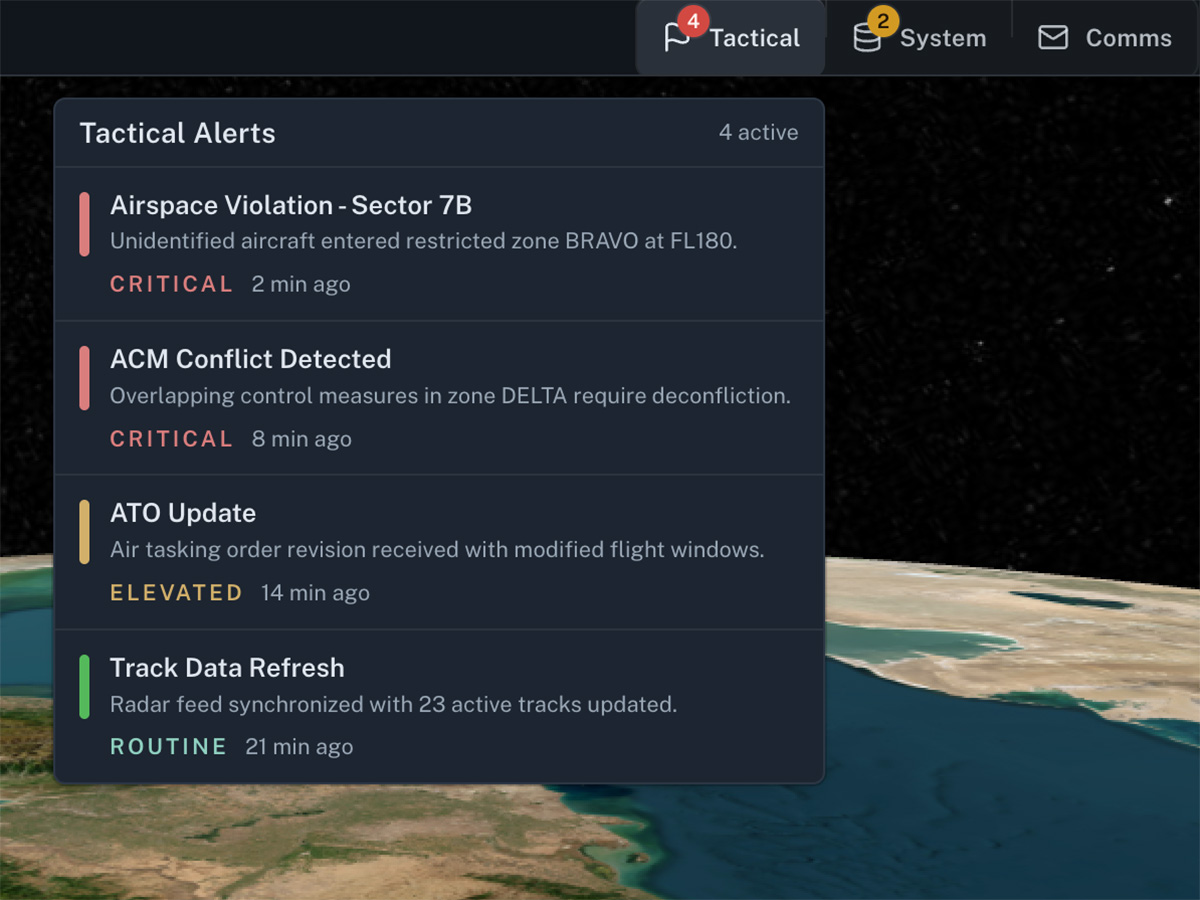
All 7 alert categories used the same shade of red. Operators had learned to ignore the notification bar.

I consolidated them into 3 groups: tactical events, communications, and system health, each with graduated severity. Safety-critical alerts are locked and cannot be downgraded.

Tactical alerts with severity written out, not carried by color alone. Not the fielded interface. Shown with mock data.

04 / Results

Measured across 5 rounds.

System Usability Scale score
68 to 83
Frustration on route creation, 21-point NASA-TLX scale
7.75 to 3.0
Faster core task times
17%
Completion on all core tasks by the final rounds
100%

The system shipped and remains in active theater deployment more than a decade later.

05 / Verification

Sponsor, period of performance, and verification contacts are available on request.

Request it by email: brad@veterandesign.com.

06 / Next step

The same method, on your product or your program.

Testing with the people who use the product, measured before and after, runs as a 4-week usability study, inside an 8-week tested prototype, or through an embedded engagement.